The front end of web development has always been seen as somewhat of a pain for developers. The reason for this, stems from the fact that there are many different non standard factors they have to account for along with the lack of tools provided to them for this purpose. Each of the major web browsers in the market today namely Google Chrome, Mozilla Firefox and Microsoft Internet Explorer[1] vary slightly in their implementation.
To help make web development easier some tools were introduced into the market. Some of them are Firebug for Firefox (v1.12.4)[2], Chrome developer tools (v30) and F12 developer tools for Internet Explorer (IE9). Each of the tools works with a different browser and has been implemented in a different way. We hope to study these tools and understand where these tools excel, and what they lack.
One has to understand that usability of these tools is very important. The easier it is to access the various features provided by these tools , the more of them that will be used. We will be looking into how the usability of the tools are important.
These tools have several areas they focus on and we hope to analyze each of these areas. This blog post focuses on the HTML, CSS and DOM panels. These are the basic components which define a web page and all of the tools have some features to assist in each of these areas. Some other things we will be looking at later include Script, Console, Network and other things which are tool specific.
Usability
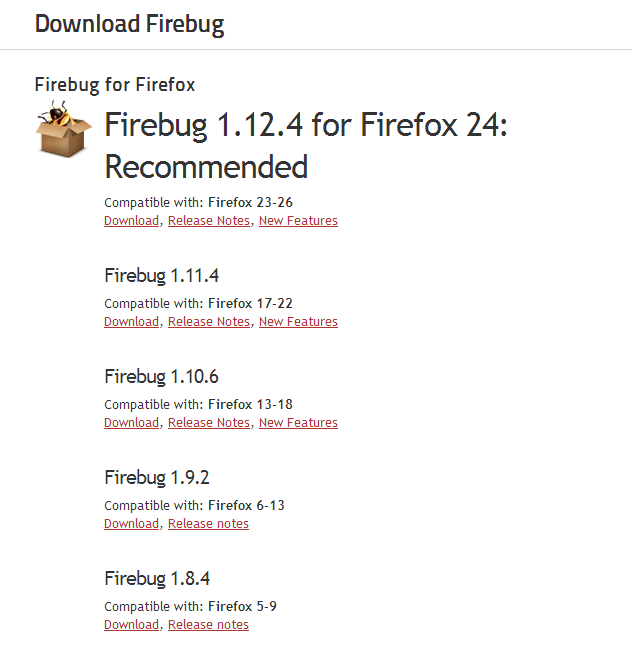
As mentioned in the introduction, the usability of a web development tool is essential[3]. In addition to the features it provides the ease of use of a tool determines how easy is it for the developer to fix the issue using the tool. For this blogpost, we analyzed and evaluated the usability of only the HTML, DOM and CSS panels. We plan to do the same for other panels in the podcast and screencast submissions. Firebug is an add on which needs to be explicitly added to Mozilla Firefox. Whereas Chrome developer tools and F12 developer tools both are inbuilt features in the Google Chrome and Microsoft Internet Explorer browsers respectively. Hence, their updates are handled more seamlessly. It took us a while to determine the correct Firebug version for the Firefox browser on which we started to gather results for this blog. This is slightly user unfriendly and it would be better if Firebug displays the download link to the Firebug which is compatible with the browser version from which it is being downloaded.
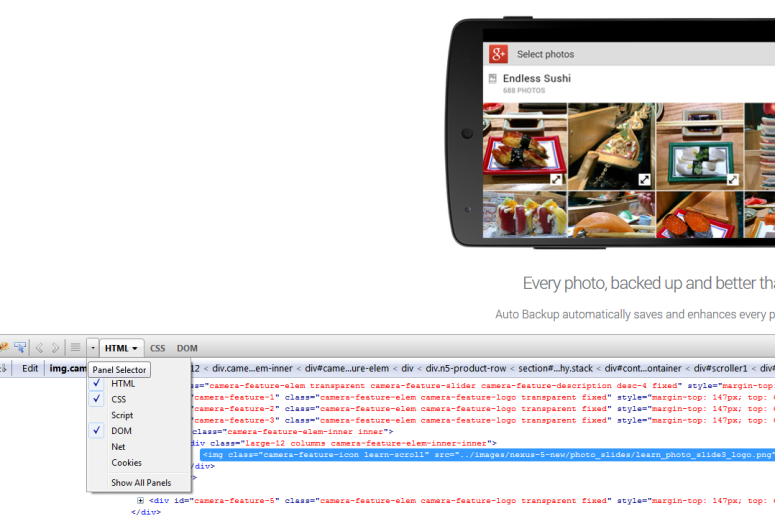
Firebug has a particularly good feature of allowing the user to display only the panels of interest to the developer. So, for example if the developer is debugging a CSS related issue such as misalignment of text or image on a web page then the developer can hide all the other panels other than the CSS panel. We found that this seemingly simple feature which is not available in Chrome Developer tools and F12 developer tools can help the user have more focus on the task at hand by not showing other panels which are irrelevant to current issue.
The Chrome developer tools use a search icon () at the bottom of the panel to indicate the “Inspect” functionality. This is a little unintuitive as the regular mouse pointer icon (
) as used in Firebug and F12 developer tools are more indicative of that feature. So, it took us a while to find how to inspect an element in Chrome developer tools. Both Chrome developer tools and F12 developer tools also don’t allow the developer to collapse and hide the right window in the HTML panel. Firebug has this option which again gives the developer the option to reduce clutter and give a much more cleaner user interface to focus on during the task.
The F12 developer tools user interface is clunky because of the Windows style menus displayed in addition to the panels. We feel that the menu options don’t provide any added functionality to F12 developer tools but only result in UI bloat.
However, a particularly useful feature we noticed in F12 developer tools was the presence of compatibility views for Internet Explorer versions ranging from 7 to 10. This enables the web developer to look at the web page in context of different Internet Explorer browser versions without the possible need to have multiple versions installed on the host. This is a must have with Internet Explorer to help maintain backward compatibility of web sites because of significant change in the way it interprets web standards like HTML, CSS etc from major version 7 to 10.
F12 Developer tools has a link which quickly allows for the page to be validated for HTML, CSS, Javascript errors. This is handy and would be a good addition to Firebug and Chrome Developer Tools. It would be interesting if this checking could be done offline.
HTML
The main HTML panel is quite similar in all tools and renders the web page in a tree like structure consisting of tags which can be expanded as required by the developer.
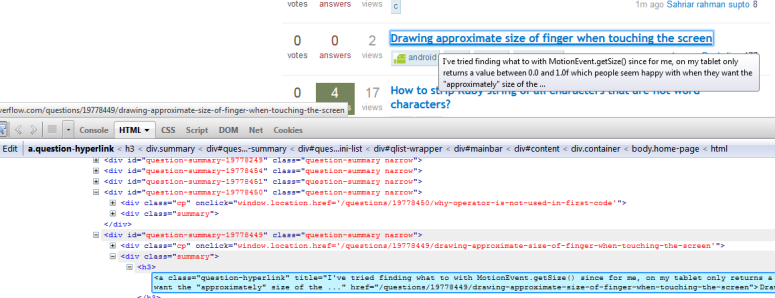
All of the tools we are studying, Firebug, Chrome developer tools and F12 developer tools allows the user to inspect various elements on a page. When hovering over a tag in the HTML panel the tools highlights the corresponding part of the page and vice versa. This is pretty helpful as it helps the user quickly determine where the tag is on the page, how big it is, its margins etc.
Firebug also draws out the path to each node on top of the HTML panel. It puts down the path starting with the node itself on the right and working its way to the html tag on the left. We felt that this may be misleading considering the fact that a web page starts with a html tag and works its way to each node.
F12 developer tools[4] renders the word “Text” before putting down any plain text within a tag. This is definitely very confusing and none of the other tools exhibit this behavior. We are unable to determine why this is done in the first place and cannot find a place where this might be of any use. It should be noted that this behavior is not uniform and F12 does not put down the word “Node” or something similar before any other node.
One of the features that we found really useful in Chrome Developer tools was its ability to help debug web pages on a mobile device. It requires the developer to connect the system to a device running Chrome and the tool on the desktop would offer the same functionality as it offered for debugging the web page in a desktop environment.
Both Chrome and Firebug offer tools to help with the debugging of actions caused by change in the DOM of the page due to javascript etc[5] . This can be seen in the DOM breakpoints subpanel. It is particularly useful because of the way web pages of today are being designed. We will look into this in more detail when we analyze the javascript and scripting console.
The HTML panel in Chrome Dev tools also allow the user to force a particular element into the hover state, or active or visited. We didn’t seem to find an equivalent capability in the other tools. We thought this could be a useful feature but also that it could be extended to force an element into more than the simple states offered here.
One flaw which we saw while using F12 developer tools on IE, was that the layout sub-panel which shows the box model for each node has no scroll-bar. It makes it very hard for the user to make changes using the panel without resizing F12.
The HTML panels on all the tools are somewhat similar, and there are no striking features that sets any of them apart, however each of the tools have small nits which the providers of the tools could work on to make the use of the tools easier.
DOM & CSS
Only Firebug has a separate panel for DOM. Whereas Chrome developer tools displays DOM related data as a “Properties” sub panel in the right window of their HTML panels and F12 developer tools doesn’t have a panel to display information specific to the DOM. The separate panel for DOM in Firebug allows the developer to view all the objects and arrays of a web page in an expandable tree view.
Overall the CSS panel is one of the most recently used panels as it allows the developers to fix alignment related issues. Since, each browser interprets CSS in a different manner the same web page can look very different in different browsers. All three of the tools allow editing of the CSS element values and see the effects of the change rendered.
For example: we found a user interface bug in www.csc.ncsu.edu when being viewed in Internet Explorer v9 with compatibility for IE7. When hovering over any of the menus like “About Us”, “Academics”, “Research” etc the corresponding entries were getting hidden underneath the Feature stories. The CSS panels of all 3 tools can be used to fix such issues.
It is worth mentioning that both Firebug and F12 developer tools have an explicit CSS panel while Chrome developer tools has a Styles subpanel in Elements to display CSS related information. Firebug and F12 developer tools edges the Chrome developer tools when it comes to CSS panel as they show both
- CSS of an element being inspected
- Contents of the entire CSS file loaded for a web page
Chrome developer tools shows only the CSS of an element being inspected. In Firebug and F12 the developer can select from a dropdown all the CSS files loaded to render this page. However, we noticed that F12 developer tools possibly downloads the CSS file again as there is a noticeable delay after selecting the CSS file from the drop down till when the file’s contents are displayed. Also, the check-boxes next to CSS elements in F12 developer tools are unintuitive as to what they enable the developer to perform.
Though the CSS panels are useful in analyzing and playing around with the layout of a web page, it is worth noting that none of the three tools provide the functionality to view the webpage and its elements in a 3D layout. This is a particularly useful feature to view elements that mistakenly are hidden due to incorrect values in the z-index of of the page.
References
- http://www.netmarketshare.com/browser-market-share.aspx?qprid=2&qpcustomd=0
- Reuven Lerner, At the Forge: Firebug, Linux Journal, v.2007 n.157, p.8, May 2007 (http://dl.acm.org/citation.cfm?id=1243939)
- Brad Myers, Scott E. Hudson, and Randy Pausch. 2000. Past, present, and future of user interface software tools. ACM Trans. Comput.-Hum. Interact. 7, 1 (March 2000), 3-28. DOI=10.1145/344949.344959 http://doi.acm.org/10.1145/344949.3449590
- http://blogs.msdn.com/b/cbowen/archive/2011/06/17/internet-explorer-9-developer-tools-deep-dive-part-2-html-amp-css.aspx
- S. Oney and B. Myers, “FireCrystal: Understanding interactive behaviors in dynamic web pages,” in Proc. of the Symposium on Visual Languages and Human-Centric Computing (VLHCC). IEEE, 2009, pp. 105-108.(http://citeseerx.ist.psu.edu/viewdoc/summary?doi=10.1.1.149.9682)
By
Raghav Tripathi & Roopak Venkatakrishnan


